Health checking for cloud native applications
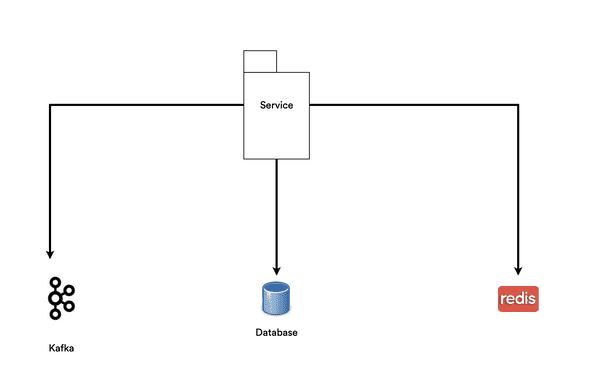
11 Aug, 2020The advent of the cloud and orchestration platforms has facilitated the provisioning of services and reduced the barrier of adoption of new components to our various architectures. This has led to services having multiple direct dependencies. A typical modern application would have a dependency tree which looks like the diagram below.
The service above requires all 3 dependencies (kafka, database, redis) for it to perform its tasks. In other words, for the application to be considered healthy, all of its dependencies must be healthy too.
Furthermore, this application and its dependencies run on kubernetes/cloud, so it is unavoidable that nodes and services would go down and come back up, hence, you have to design applications to be able to recover and deal with all this flux.
Kubernetes determines an application’s health by calling its configured healthcheck. Below is an example of what a kubernetes healthcheck config would look like
livenessProbe:
  httpGet:
    initialDelaySeconds: 20 # Number of seconds after startup before probe is initiated
    periodSeconds: 10 # How often (in seconds) to perform the probe
    path: /health # Healthcheck path
    port: 8080 # Healthcheck port
    failureThreshold: 3 # Kubernetes will try 3 times before giving up.
    successThreshold: 1 # Minimum consecutive successes for the probe to be considered successful after having failed
The code above says, wait 20 seconds for the application to startup, then perform a call to port 8080 on path /health every 10 seconds. If it gets 3 consecutive failures (non 200 status code), at which point kuberentes would keep restarting the service with increasing backoff until it gets a success.
For your application to function properly on kubernetes, it is important for it to have a healthcheck endpoint.
So unto the purpose of this post.
Over the years, very often most healthchecks are done at the very end of the project and only done to keep the platform happy.
(GET "/health" []
   {:status 200
    :body "OK"})
The problem with any variant of the code above, is that it always says the service is healthy as long as it is listening on the configured port, regardless of the status of its required dependencies. This often leads to zombie services - which look alive to the outside but dead on the inside.
A proper healthcheck should check the status of all its required dependencies and short circuit when a dependency fails. It is pointless for a service to accept requests if it is unable to correctly respond to them.
With the applications I have been working on recently I wanted to ensure they had proper healthchecks and could immediately inform me as to why a health check was failing.
Below is how I implemented this using clojure.
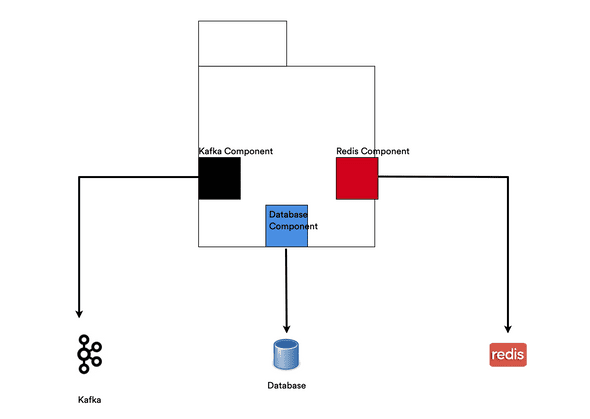
I come from an engineering background so it helps thinking of applications as systems, with systems comprising of well built, self contained, composable components.
Each component which interfaces with an external system contains all the domain knowledge on how to interact with that system.
I used Stuart Sierra’s library to represent and assemble the system.
I started of by defining a protocol with a single method which asks if a component within the system is healthy.
(defprotocol Healthy
  (healthy? [component]))
Each component would then implement this protocol within its own domain.
In the redis domain health is checked by issuing a ping command
(extend-type RedisComponent
  h/Healthy
  (healthy? [this]
    (try
      (let [{{:keys [server-conn]} :redis} this
            resp (wcar* server-conn
                        (carmine/ping))]
        {:healthy? true :response resp})
      (catch Throwable _
        {:healthy? false :response "Down"}))))
And in the kafka domain, I check if kafka and the schema registry are running, the kafka clients have methods for that
(extend-type KafkaComponent
  h/Healthy
  (healthy? [this]
    (try
      (let [{:keys [kafka-healthchecker sc-client]} this
            {kafka-healthy? :healthy?} (kafka-healthchecker)
            {schema-healthy? :healthy?} (schema-registry/healthcheck sc-client)]
        (if (and kafka-healthy? schema-healthy?)
          {:healthy? true :response "Up"}
          {:healthy? false :response "Down"})))))
I then created a HealthComponent which depended on all the components which implemented the Healthy protocol
(defrecord HealthComponent [db redis kafka]
  component/Lifecycle
  (start [this]
    this)
  (stop [this]
    this))
Then a function which takes the HealthCompoment and checks that all its dependencies are healthy
(defn system-healthy? [health-comp]
  (let [deps (component/dependencies health-comp)
        deps-status (map (fn [[k v]]
                           {:component k ;; Labelling the status with component name
                            :status (h/healthy? (v health-comp))})
                         deps)]

    {:healthy? (every? #(get-in % [:status :healthy?]) deps-status)
     :response deps-status}))
Then all I have to do for my healthcheck is to call the system-healthy? function above
(GET "/health" []
  (let [{:keys [healthy? response]} (system-healthy? health-comp)
                resp (if healthy? ;; false if any of the dependencies returns false
                       {:status 200 :body response :headers {"Content-Type" "text/json"}}
                       {:status 500 :body response :headers {"Content-Type" "text/json"}})]))
The output looks like this for a healthy system
 curl -sv localhost:8080/health | jq
> GET /health HTTP/1.1
> Host: localhost:8080
>
< HTTP/1.1 200 OK
< Content-Type: text/json
[
  {
    "component": "db",
    "status": {
      "healthy?": true,
      "response": null
    }
  },
  {
    "component": "redis",
    "status": {
      "healthy?": true,
      "response": "PONG"
    }
  },
  {
    "component": "kafka",
    "status": {
      "healthy?": true,
      "response": "Up"
    }
  }
]
As you can see the health check returns a status 200 and all components are healthy
I then stopped redis and ran the healthcheck again
docker-compose stop redisAnd the output was …
curl -sv localhost:8080/health | jq
> GET /health HTTP/1.1
> Host: localhost:8080
>
< HTTP/1.1 500 Server Error
< Content-Type: text/json
[
  {
    "component": "db",
    "status": {
      "healthy?": true,
      "response": null
    }
  },
  {
    "component": "redis",
    "status": {
      "healthy?": false,
      "response": "Down"
    }
  },
  {
    "component": "kafka",
    "status": {
      "healthy?": true,
      "response": "Up"
    }
  }
]
As you can see the healthcheck is failing with status 500, and I can clearly see that redis is not healthy.
This pattern has resulted in a lot more resilence and “self healing” in my applications, as kubernetes is able to correctly detect transient downtime (which is to be expected in the cloud) and restart failing services.
Even in the cloud, the good old “have you turned it off and on again ?” works, you just need to ensure your application has the proper healthchecks, then the platform does the rest.

